Image Details
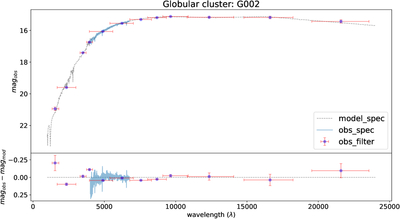
Caption: Figure 4.
Joint spectral and photometric fitting for star cluster G002 using BC03 models. Top panel: The observed spectrum (blue solid line) and photometry (blue points) overlaid with the best-fit model (gray dashed line). Horizontal error bars on photometric points represent the filter bandwidths, while vertical bars indicate photometric uncertainties. Bottom panel: The fitting residuals.
Other Images in This Article
Copyright and Terms & Conditions
© 2026. The Author(s). Published by the American Astronomical Society.
Copyright ©
2026 Astronomy Image Explorer. All Rights Reserved.