Image Details
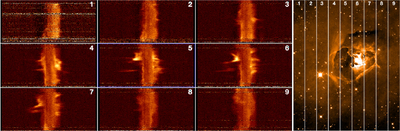
Caption: Figure 23.
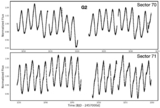
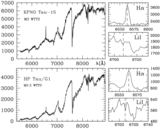
Left panels: spatial-velocity cuts through the 12CO data cube, in which the horizontal axis is the radial velocity ranging from VLSR = −1.0 km s−1 on the left to VLSR = +12.0 km s−1 or the right. The vertical axis is the R.A. ranging from R.A. = 04:35:22.746 (68.8448) at the bottom of each panel to 04:36:22.790 (69.0950) at the top. Each panel is summed over a 75″ range in decl. Panel (1) is the southernmost strip; panel (9) is the northernmost strip. Right panels: the locations of the spatial-velocity strips are shown here on a visual-wavelength image. North is to the right, and east is up. Image courtesy of Adam Block.
Other Images in This Article
Show More
Copyright and Terms & Conditions
© 2026. The Author(s). Published by the American Astronomical Society.