Image Details
Caption: Figure 22.
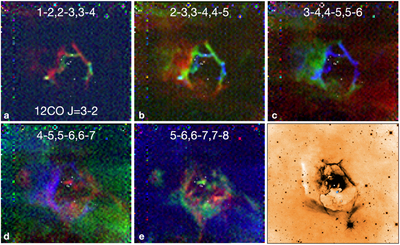
12CO J = 3–2 in five channel maps displayed as three-color images in which three ∼1 km s−1 wide channels are shown in red, green, and blue, as indicated. Velocities are in local standard of rest. The peak of the CO emission is at VLSR = 5.93 km s−1. The figure shows in finer detail the velocities of the cavity surrounding G2. The blue asterisk in the last panel shows where the triple system broke up, and the two white dots represent G2 and KPNO 15. The merger took place somewhere between the blue asterisk and the current position of G2.
(The data used to create this figure are available in the online article.)
(The data used to create this figure are available.)
Other Images in This Article
Show More
Copyright and Terms & Conditions
© 2026. The Author(s). Published by the American Astronomical Society.