Image Details
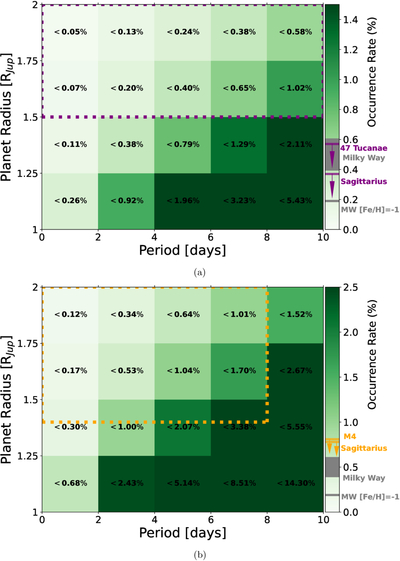
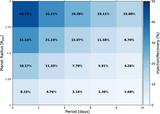
Caption: Figure 8.
The first upper limit on the hot Jupiter occurrence rate in the Sagittarius dwarf galaxy across a radius range of 1RJup–2RJup with orbital periods < 10 days. Occurrence rates at the 68% and 95% confidence levels are shown in panels (a) and (b), respectively, and were calculated using Equation (6). The values at the center of each box represent the occurrence rate upper limit for that bin in planetary parameters shown as a percent. For 1RJup–2RJup hot Jupiters with periods of 0.6–10 days we calculate an average 1σ occurrence rate upper limit of <1.01%. In panel (a) we compare our results to the 1σ occurrence rate upper limit of <0.57% calculated by A. L. Crisp et al. (2025) for the globular clusters 47 Tucanae within the parameter space of 1.5RJup–2RJup and <10-day periods outlined by the dotted purple box. Within the same parameter space we find a 1σ occurrence rate upper limit value of <0.37% for the Sagittarius dwarf galaxy stream. In panel (b) we compare our results to the 2σ occurrence rate upper limit of <0.81% calculated by J. J. Wallace et al. (2020) for the globular cluster M4 within the parameter space of 1.4RJup–2RJup and <8-day periods outlined by the dotted orange box. Within the same parameter space we find a 2σ occurrence rate upper limit value of <0.78% for the Sagittarius dwarf galaxy stream. The color bars of each panel are labeled with the calculated upper limits for each region within the highlighted parameter space. The gray box on each color bar represents the range of 0.4%–0.6% for hot Jupiter occurrence rate seen in the Milky Way, and the gray bar labeled “MW [Fe/H] = −1” represents the Milky Way hot Jupiter occurrence rate scaled to an [Fe/H] = −1 representative of the low-metallicity environment of the Sagittarius dwarf galaxy stream.
Other Images in This Article
Copyright and Terms & Conditions
© 2026. The Author(s). Published by the American Astronomical Society.