Image Details
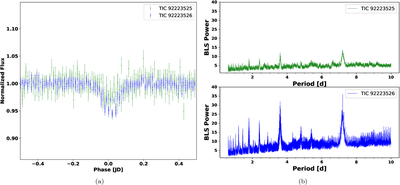
Caption: Figure 6.
Panel (a) shows the folded light curve of our candidate star TIC 92223525 overlaid with the folded light curve of the neighboring star TIC 92223526 identified as the source of the signal (blue star in Figure 5). Each plotted color matches the star color from Figure 5, and each circle/error bar represents the light-curve data at a binned cadence of 30 minutes. In panel (b) we compare the BLS periodogram results for each star and show that the periodogram of TIC 92223526 has a much stronger power at the candidate period.
Other Images in This Article
Copyright and Terms & Conditions
© 2026. The Author(s). Published by the American Astronomical Society.
Copyright ©
2026 Astronomy Image Explorer. All Rights Reserved.