Image Details
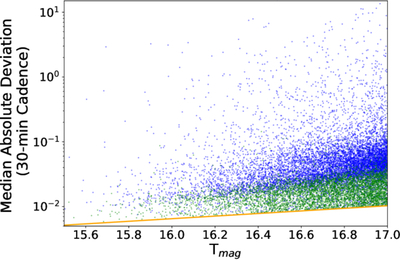
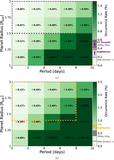
Caption: Figure 2.
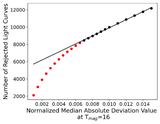
The normalized median absolute deviation of each light curve in our survey as a function of Tmag, where the 9768 light curves reduced with TGLC are shown blue and the 5408 light curves reduced with eleanor are shown in green. For the faint target stars observed in the most crowded fields of our survey, significant contamination from nearby bright neighboring stars can lead to light curves with median absolute deviation values that fall below the predicted noise limit (A. D. Feinstein et al. 2019). To remove these highly contaminated light curves, we plotted the number of stars rejected at a series of Poisson-like noise cutoffs and selected the cutoff where the function began to deviate from the linear function seen at brighter median absolute deviation cutoffs (see Figure 1). We show this selected noise cutoff as an orange curve in the scatter plot.
Other Images in This Article
Copyright and Terms & Conditions
© 2026. The Author(s). Published by the American Astronomical Society.