Image Details
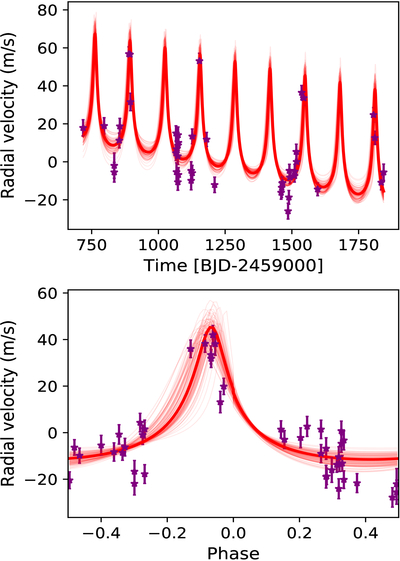
Caption: Figure 6.
Top: a linear slope showing the PFS radial velocities over time. The trend is detected at ﹩-0.028{0}_{-0.0045}^{+0.0046}\,{\rm{m}}\,{{\rm{s}}}^{-1}{{\rm{day}}}^{-1}﹩. Longer-term monitoring is necessary to confirm the orbital period of the outer companion. Bottom: PFS radial velocity observations phase folded to the ephemeris for better clarity. The solid, bold, red line is the best-fit model from EXOFASTv2 using RVs from all four facilities. The finer red lines show a small selection of draws from the converged posterior. Section 2.2 details the radial velocity observations.
Other Images in This Article


Copyright and Terms & Conditions
© 2026. The Author(s). Published by the American Astronomical Society.
Copyright ©
2026 Astronomy Image Explorer. All Rights Reserved.