Image Details
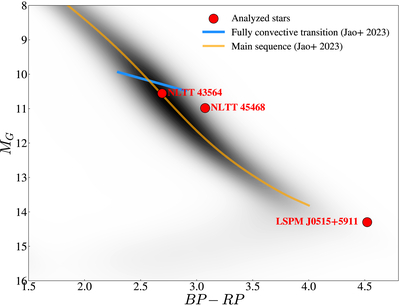
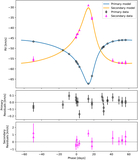
Caption: Figure 8.
Color–magnitude diagram for nearby stars (within 100 pc) showing the local main sequence in MG vs. BP − RP. The background density map is constructed from the Gaia Catalog of Nearby Stars (Gaia Collaboration et al. 2021). The three analyzed binary star targets, LSPM J0515+5911, NLTT 45468, and NLTT 43564, are plotted as red markers and they include light from the unresolved companion as seen by Gaia. The blue line indicates the observational transition to fully convective M dwarfs and the orange curve shows the empirical main-sequence points from W.-C. Jao et al. (2023).
Other Images in This Article
Copyright and Terms & Conditions
© 2026. The Author(s). Published by the American Astronomical Society.
Copyright ©
2026 Astronomy Image Explorer. All Rights Reserved.