Image Details
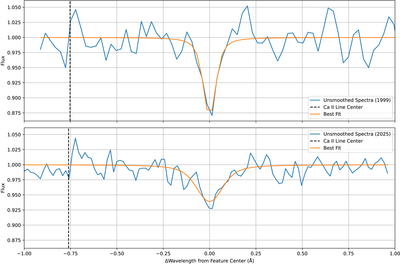
Caption: Figure 6.
Comparison of the Ca II absorption feature in the Keck HIRES spectra of WD 0644+025 from 1999 (top) and 2025 (bottom). For analysis, both spectra are smoothed using a 1D boxcar kernel with a width of 3 pixels and normalized to the local continuum approximately 4 Å on either side of the line. The unsmoothed, continuum-normalized spectrum is shown as the blue curve, and the best-fit Voigt profile is shown as the orange curve. Both epochs are calibrated using an air wavelength solution, and the dashed vertical line indicates the Ca II rest wavelength at 3933.663 Å.
Other Images in This Article
Copyright and Terms & Conditions
© 2026. The Author(s). Published by the American Astronomical Society.
Copyright ©
2026 Astronomy Image Explorer. All Rights Reserved.