Image Details
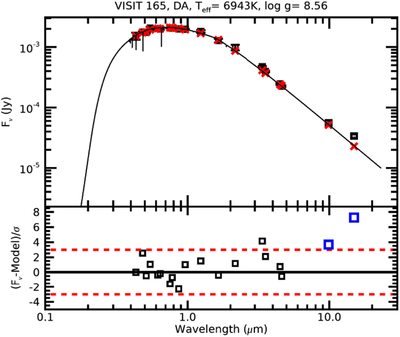
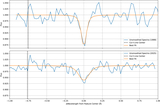
Caption: Figure 3.
Top: the measured SED of WD 0644+025 (black squares) compared to a DA cooling model with Teff = 6943 K and ﹩{\mathrm{log}}g﹩ = 8.56 (red squares). Bottom: the residuals between modeled and observed photometry in units of sigma. The observed JWST MIRI photometry is shown with blue squares, and archival photometry is shown with black squares. The red dashed line denotes a 3σ deviation from the model. The observed JWST MIRI photometry exceeds the expected photospheric flux by 3.6σ in F1000W and 7.3σ in F1500W.
Other Images in This Article
Copyright and Terms & Conditions
© 2026. The Author(s). Published by the American Astronomical Society.
Copyright ©
2026 Astronomy Image Explorer. All Rights Reserved.