Image Details
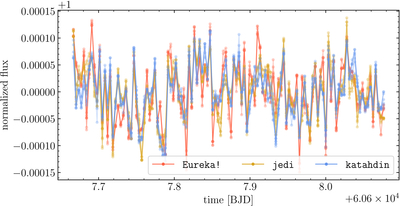
Caption: Figure 2.
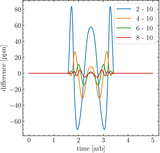
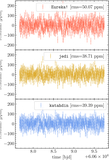
A zoomed-in view of exposure 1 for all 18 5 minutes light curves after dividing out the best-fit quadratic trend from each. Note that all reductions tend to agree on the overall structure of the time series, and that reductions derived from the same pipeline tend to agree with each other.
Other Images in This Article
Show More
Copyright and Terms & Conditions
© 2026. The Author(s). Published by the American Astronomical Society.
Copyright ©
2026 Astronomy Image Explorer. All Rights Reserved.