Image Details
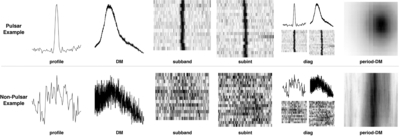
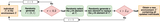
Caption: Figure 11.
Examples of HTRU data. The top row shows the pulsar samples, and the bottom row shows nonpulsar samples. From left to right: profile, DM-curve, subband plots, subintegration plots, diagnostic plots, and period–DM plots.
Other Images in This Article


Show More
Copyright and Terms & Conditions
© 2026. The Author(s). Published by the American Astronomical Society.
Copyright ©
2026 Astronomy Image Explorer. All Rights Reserved.