Image Details
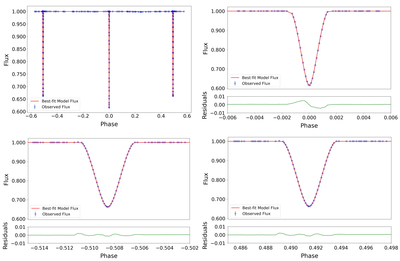
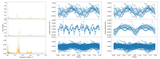
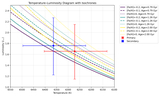
Caption: Figure 4.
Comparison between the best-fit model (red line) and the photometric data during the second orbital cycle. The top-left panel shows the full light curve over phase −0.5–0.5, centered on the primary eclipse at phase 0.0. The remaining panels show zoomed-in views around the primary and secondary eclipses, with residuals (data − model) displayed below each corresponding light curve.
Other Images in This Article
Copyright and Terms & Conditions
© 2026. The Author(s). Published by the American Astronomical Society.
Copyright ©
2026 Astronomy Image Explorer. All Rights Reserved.