Image Details
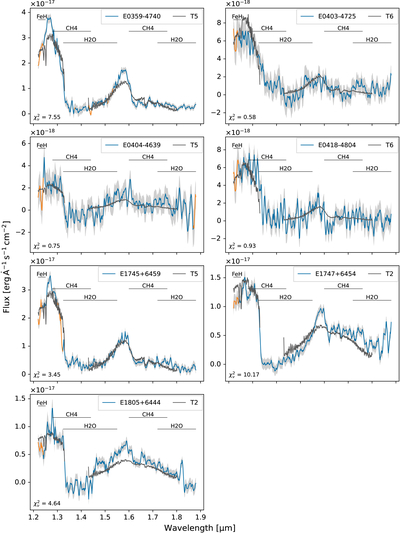
Caption: Figure 4.
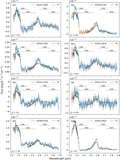
Comparison of smoothed candidate spectra (blue curves) with the Theissen templates (dark gray curves) for the 15 selected candidates. As shown in Figure 2, the orange curves denote flagged values, while the gray shading indicates the flux uncertainty. Key molecular absorption features are marked by horizontal black lines. The inferred spectral types based on the Theissen templates are generally consistent with those derived from the Burgasser templates and agree within one subtype.
Other Images in This Article
Copyright and Terms & Conditions
© 2026. The Author(s). Published by the American Astronomical Society.
Copyright ©
2026 Astronomy Image Explorer. All Rights Reserved.