Image Details
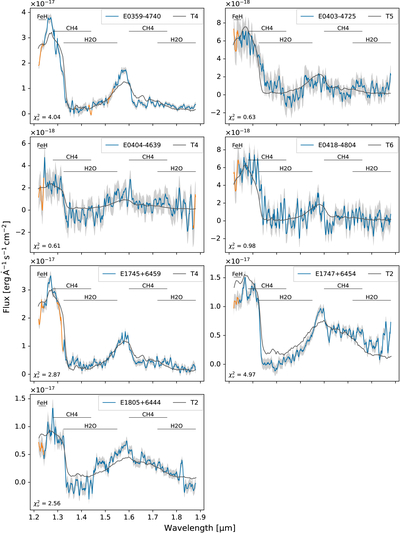
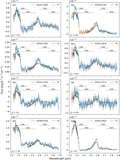
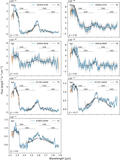
Caption: Figure 2.
Comparison of smoothed candidate spectra (blue curves) with the Burgasser templates (dark gray curves) for the 15 selected candidates. The orange curves represent flagged values (e.g., due to low quality or artifacts). The shaded gray area around each spectrum represents the flux uncertainty. Key molecular absorption features are indicated by horizontal black lines (FeH, CH4, and H2O). Specifically, CH4 bands span 1.28–1.44 μm in the J band and 1.6–1.76 μm in the H band; H2O bands span 1.325–1.55 μm in the J band and 1.72–2.14 μm in the H band. While several spectra exhibit clear methane absorption features characteristic of mid-to-late T dwarfs (e.g., at 1.3 and 1.6 μm), others show considerable noise or deviations from the templates, reflecting the limitations of low-resolution slitless spectroscopy and varying data quality in the Euclid Q1 release. The reduced chi-squared fit statistic, displayed in the bottom-left corner, provides a quantitative measure of the fit quality.
Other Images in This Article
Copyright and Terms & Conditions
© 2026. The Author(s). Published by the American Astronomical Society.