Image Details
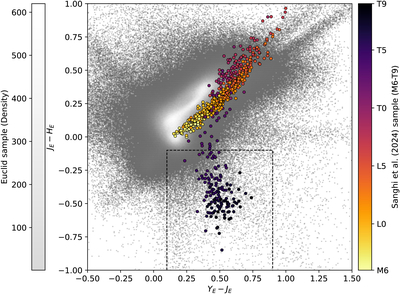
Caption: Figure 1.
Color–color diagram showing the Euclid YE − JE vs. JE − HE color space. The grayscale background represents the density of sources from the Euclid Q1 dataset, limited to high-quality detections and magnitudes brighter than 23 mag in all three bands. Overplotted are synthetic Euclid colors of M6–T9 UCDs from the A. Sanghi et al. (2024) sample, colored by spectral type. Mid-to-late T dwarfs clearly deviate from earlier-type UCDs, forming a distinct population toward redder YE − JE and bluer JE − HE colors. The black dashed lines indicate the adopted color selection boundaries (0.1 < YE − JE < 0.9 and JE − HE < −0.1) used to identify candidate mid-to-late T dwarfs in the Euclid Q1 dataset.
Other Images in This Article
Copyright and Terms & Conditions
© 2026. The Author(s). Published by the American Astronomical Society.