Image Details
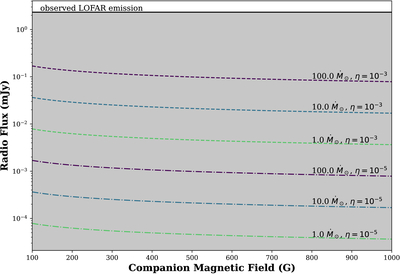
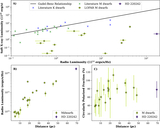
Caption: Figure 5.
The expected radio flux due to an interaction between the stellar wind of the primary and the magnetosphere of the secondary as a function of the strength of the dipolar component of the secondary’s magnetic field. Different line colors indicate different mass-loss rates from the primary (1, 10, and 100 ﹩{\dot{M}}_{\odot }﹩), and different line styles indicate the conversion efficiency from ram pressure to radio flux (10−5 and 10−3). The gray shaded region indicates where the emission caused by such an interaction is not consistent with the LOFAR observation.
Other Images in This Article
Copyright and Terms & Conditions
© 2026. The Author(s). Published by the American Astronomical Society.
Copyright ©
2026 Astronomy Image Explorer. All Rights Reserved.