Image Details
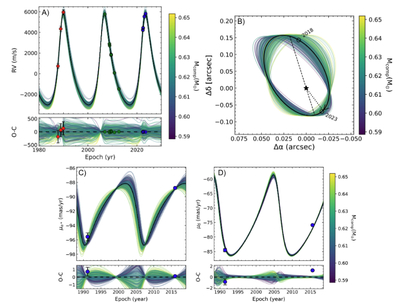
Caption: Figure 3.
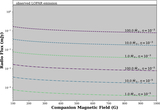
(A) Time series of RV observations of HD 220242 with archival data denoted in red (B. Nordstrom et al. 1997) and green (M. Hartmann 2019). The HPF RV data are given in blue and the best-fitting model from the orvara analysis is included in black. (B) The projected astrometric orbit of HD 220242B, including the time stamps for the LOFAR (2018) and NESSI (2023) observations. (C) The proper motion of HD 220242 in R.A., where the two blue points indicate the Hipparcos and Gaia measurements. (D) The proper motion of HD 220242 in decl., where the two blue points indicate the Hipparcos and Gaia measurements. In panels (A), (C), and (D), the lower insets show the difference between observed and calculated points for either RVs (panel (A)) or astrometry (panels (C) and (D)). For all panels, the thick black line is the best-fitting orbit from joint modeling of the RVs, the HGCA inputs, and the Hipparcos IAD, and the other lines are 100 random draws from the posterior distribution, colored by the mass of the secondary. The RVs are available as data behind the figure.
(The data used to create this figure are available in the online article.)
(The data used to create this figure are available.)
Other Images in This Article
Copyright and Terms & Conditions
© 2026. The Author(s). Published by the American Astronomical Society.