Image Details
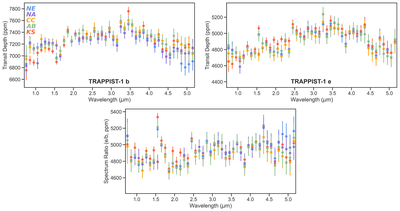
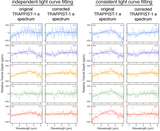
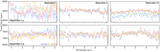
Caption: Figure 14.
The TRAPPIST-1 b and TRAPPIST-1 e transmission spectra, along with the resulting spectroscopic ratio, for the consistent light-curve fitting test. All reductions show close agreement, suggesting that the differences in spectra seen in Figure 3 are due to choices made during the light-curve fitting process rather than the generation of the light curves from the raw data.
Other Images in This Article
Show More
Copyright and Terms & Conditions
© 2026. The Author(s). Published by the American Astronomical Society.
Copyright ©
2026 Astronomy Image Explorer. All Rights Reserved.