Image Details
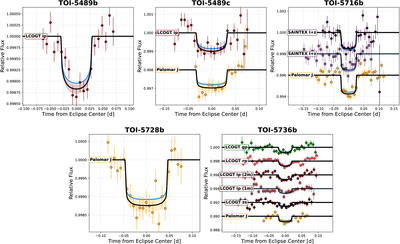
Caption: Figure 4.
Multicolor ground-based light curves for our five targets. Data points represent 10 minute binned photometry, with light curves obtained using identical filters and exposure times phase folded together. Black curves show the median transit model derived from the posterior distribution, with colored shading indicating the 68% confidence intervals. Blue curves represent the nominal TESS light-curve model projected into the corresponding ground-based filters.
Other Images in This Article
Copyright and Terms & Conditions
© 2026. The Author(s). Published by the American Astronomical Society.
Copyright ©
2026 Astronomy Image Explorer. All Rights Reserved.