Image Details
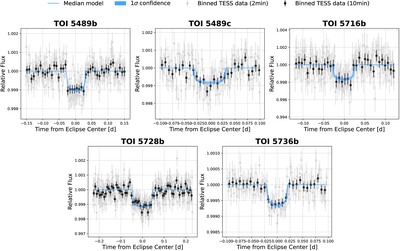
Caption: Figure 3.
Stacked TESS light curves for our five targets. Gray points show the 2 minute binned data, and black points show the 10 minute binned data. The blue line represents the median transit model from the posterior distribution, with light blue shading indicating the 68% confidence interval.
Other Images in This Article
Copyright and Terms & Conditions
© 2026. The Author(s). Published by the American Astronomical Society.
Copyright ©
2026 Astronomy Image Explorer. All Rights Reserved.