Image Details
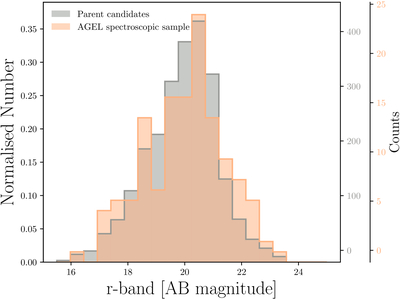
Caption: Figure 10.
Number density histogram of deflector r-band magnitudes. The AGEL parent candidate sample from C. Jacobs et al. (2019a, 2019b), X. Huang et al. (2020, 2021) is shown in gray, with the spectroscopic sample in orange. Based on 1000 realizations of the parent sample, we find the two distributions statistically consistent.
Other Images in This Article
Show More
Copyright and Terms & Conditions
© 2025. The Author(s). Published by the American Astronomical Society.
Copyright ©
2025 Astronomy Image Explorer. All Rights Reserved.