Image Details
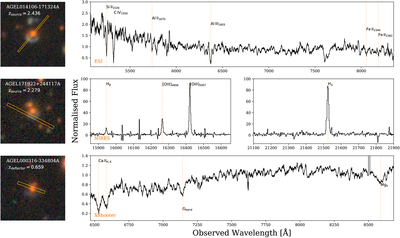
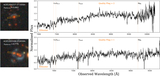
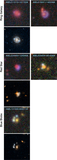
Caption: Figure 6.
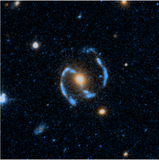
Example AGEL spectra. The top row shows the source spectrum from ESI with the z = 2.436 redshift measured from interstellar medium absorption features. The middle row is a z = 2.279 NIRES source spectrum measured from nebula emission lines. The bottom panel is a z = 0.659 X-shooter deflector spectrum measured from stellar absorption features. grz 25″ × 25″ DECaLS images are shown in the left column with north oriented up and east left. Key spectral features used in the redshift measurement are shown with dotted orange lines. The slit position is shown as an orange rectangle overlaying the DECaLS image. All spectra have a quality flag of 3.
Other Images in This Article
Show More
Copyright and Terms & Conditions
© 2025. The Author(s). Published by the American Astronomical Society.