Image Details
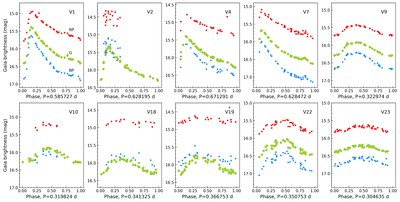
Caption: Figure 3.
Phase-folded light curves of the M9 RRL sample, based on Gaia epoch photometry and variability periods. Red, green, and blue points correspond to GRP, G, and GBP passbands, respectively. Note that for V2 and V10, the phase coverage of the red and blue bands is very poor, while for V2, V10, V18, and V19, the GBP data are very close to or above the G-band points. In both cases, they lead to incorrect estimates of the mean magnitude.
Other Images in This Article
Copyright and Terms & Conditions
© 2025. The Author(s). Published by the American Astronomical Society.
Copyright ©
2025 Astronomy Image Explorer. All Rights Reserved.