Image Details
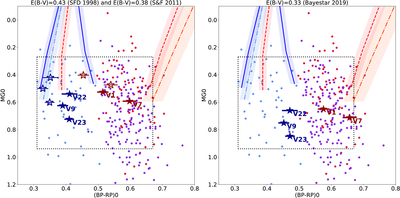
Caption: Figure 4.
The RRL CMD at the metallicity of M9. Small points represent the Gaia sample, with blue, purple, and red corresponding to RRc, OoI RRab, and OoII RRab stars, respectively. The origins of low-luminosity points are discussed in the text, and the dotted square corresponds to the observed RRL distribution of GCs (M. Cruz Reyes et al. 2024). The solid and dashed lines indicate the M. Marconi et al. (2015) instability strip (IS) edges, for RRc (blue) and RRab (red) models. The dashed–dotted light blue and orange lines represent the outer edges of the RRL IS published by M. Marconi et al. (2003) and M. Di Criscienzo et al. (2004). Large star symbols are the M9 RR Lyrae stars for which we found the Gaia color data to be accurate. In the left and right panels, we show these M9 stars using the SFD 1998 (empty), S&F 2011 (filled), and Bayestar 2019 reddening zero-points, respectively. The Bayestar and the S&F 2011 values place the RR Lyrae stars within physically plausible limits, serving as reasonable bounds for the reddening in front of M9, whereas the SFD 1998 zero-point shifts one of the RRab stars into the RRc instability strip, supporting the idea that it causes an overestimation.
Other Images in This Article
Copyright and Terms & Conditions
© 2025. The Author(s). Published by the American Astronomical Society.