Image Details
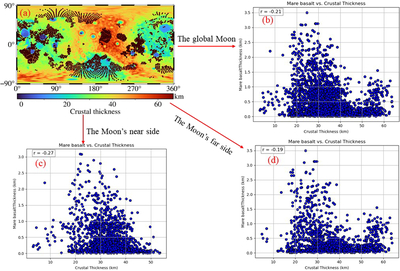
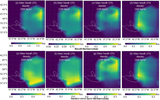
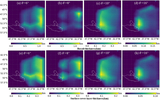
Caption: Figure 15.
Scatter plot of the relationship between basalt and crust thickness in the cryptomaria region. (a) Scatter distribution of the cryptomaria region (the base map shows the distribution of crust thickness; M. A. Wieczorek et al. 2013). Panel (b) is the scatter plot of the relationship between basalt thickness and crust thickness in the lunar cryptomaria region. Panels (c) and (d) represent scatter plots of the relationship between the thickness of the crust and mare basalt on the far and near sides of the Moon, respectively.
Other Images in This Article

Show More
Copyright and Terms & Conditions
© 2025. The Author(s). Published by the American Astronomical Society.
Copyright ©
2025 Astronomy Image Explorer. All Rights Reserved.