Image Details
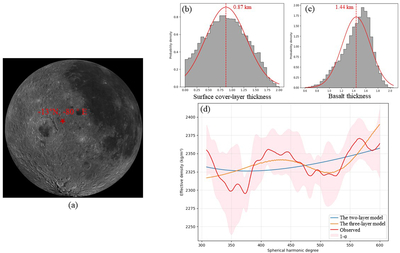
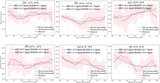
Caption: Figure 3.
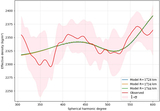
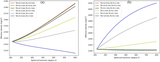
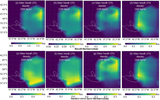
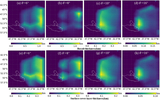
Example inversion diagram of any selected point. (a) LROC global image of the Moon with example point marked for inversion results in parts b-d. Panels (b) and (c) are the histogram of the thickness distribution of the surface cover-layer and mare basalt, where the red curve is the best fit to the histogram. (d) Distribution curve diagram of model density and theoretical density spectrums. The distribution curve diagram of model density spectrum and theoretical density spectrum, where the blue (∼1.21 km) and orange lines represent the results based on the three-layer density structure model (∼1.44 km), respectively.
Other Images in This Article

Show More
Copyright and Terms & Conditions
© 2025. The Author(s). Published by the American Astronomical Society.