Image Details
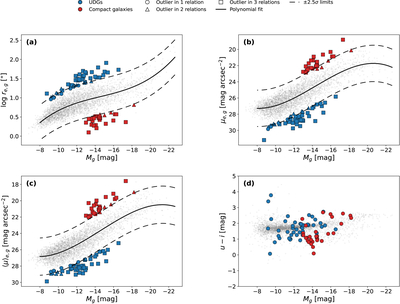
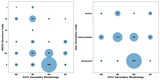
Caption: Figure 13.
Scaling relations for NGVS galaxies with ﹩\mathrm{log}{M}_{\star }\,\leqslant \,10﹩. Panels: (a) size–magnitude (﹩\mathrm{log}{r}_{e,g}﹩ vs. Mg), (b) effective surface brightness (μe,g vs. Mg), (c) mean surface brightness within one effective radius (〈μ〉e,g vs. Mg), and (d) color–magnitude (u − i vs. Mg). Black curves show polynomial fits to the NGVS population; long-dashed black lines mark the ±2.5σ envelopes. UDG candidates (blue) and compact galaxies (red) are highlighted. Marker shape encodes how many relations the object is an outlier in: circles = 1, triangles = 2, squares = 3. Outliers are defined as points lying outside the ±2.5σ envelope of the corresponding fit.
Other Images in This Article
Show More
Copyright and Terms & Conditions
© 2025. The Author(s). Published by the American Astronomical Society.