Image Details
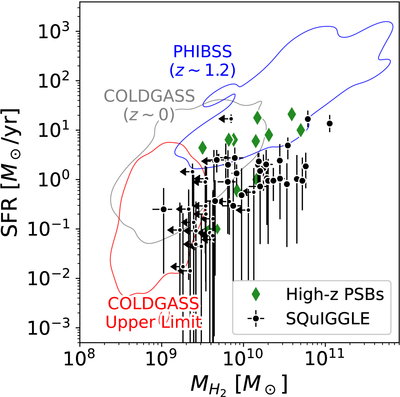
Caption: Figure 5.
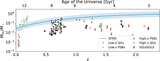
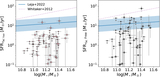
Molecular gas mass vs. SFR. As background contours, we show literature star-forming samples: COLDGASS detected (gray), undetected (red; A. Saintonge et al. 2011), and PHIBSS/PHIBSS2 (blue; L. J. Tacconi et al. 2018; J. Freundlich et al. 2019). As green diamonds, we show literature post-starburst samples (S. Belli et al. 2021; C. Woodrum et al. 2022; P.-F. Wu et al. 2023), with SFRs derived from SED fitting that incorporates MIR data. In black, we show SQuIGG﹩\overrightarrow{L}﹩E, with the SFRs measured in K. A. Suess et al. (2022a). Under the assumptions in that fitting (and with αCO = 4.0), the entire SQuIGG﹩\overrightarrow{L}﹩E sample lies below the SFR–﹩{M}_{{{\rm{H}}}_{2}}﹩ relation, suggesting that star formation in SQuIGG﹩\overrightarrow{L}﹩E post-starburst galaxies at fixed ﹩{M}_{{{\rm{H}}}_{2}}﹩ is low relative to typical star-forming galaxies.
Other Images in This Article
Show More
Copyright and Terms & Conditions
© 2025. The Author(s). Published by the American Astronomical Society.