Image Details
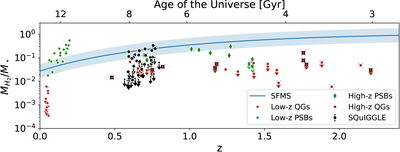
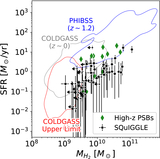
Caption: Figure 4.
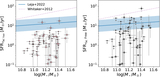
Redshift vs. molecular gas fraction for passive galaxies with ﹩\mathrm{log}({M}_{\odot }/{M}_{\star })\gt 10.8﹩. We show the scaling relation for star-forming galaxies with ﹩\mathrm{log}({M}_{\star }/{M}_{\odot })=11﹩ from L. J. Tacconi et al. (2018) in blue with the shaded region denoting 0.3 dex scatter. Low- (T. A. Davis et al. 2016) and high-z (M. T. Sargent et al. 2015; R. Gobat et al. 2018; J. Spilker et al. 2018; J. N. Caliendo et al. 2021; G. E. Magdis et al. 2021; K. E. Whitaker et al. 2021b; C. C. Williams et al. 2021; S. Adscheid et al. 2025) quiescent galaxies are shown as red circles and squares, respectively, with white outlines indicating measurements from individual sources and black outlines indicating measurements from stacking. Similarly, low- and high-z post-starburst galaxies from the literature are shown as green circles (K. D. French et al. 2015; K. Alatalo et al. 2016b; D. Baron et al. 2023) and diamonds (J. Spilker et al. 2018; P.-F. Wu et al. 2023; A. Zanella et al. 2023; K. A. Suess et al. 2025). When literature measurements are of dust continuum, δGDR = 100 is adopted; these measurements are indicated with × behind their point. Finally, as black circles, we show the SQuIGG﹩\overrightarrow{L}﹩E sample. In contrast with older quiescent galaxies, which tend to have very low molecular gas fraction across cosmic time, post-starburst galaxies exhibit a wide spread in the molecular gas fraction. This is exemplified by SQuIGG﹩\overrightarrow{L}﹩E, where some galaxies have gas fractions high enough to place them on the main sequence, and some galaxies have fractions that are constrained to lie more than an order of magnitude below.
Other Images in This Article
Show More
Copyright and Terms & Conditions
© 2025. The Author(s). Published by the American Astronomical Society.