Image Details
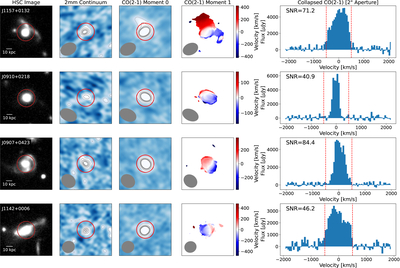
Caption: Figure 2.
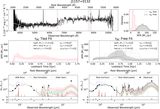
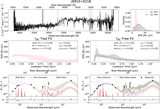
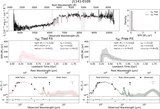
12″ × 12″ cutouts of the four most CO-luminous SQuIGG﹩\overrightarrow{L}﹩E galaxies in the new sample. For each galaxy, we show the HSC i-band image, the 2 mm continuum image (collapsing the three ALMA spectral windows that were not centered on CO(2–1)), the CO(2–1) Moment 0 image, the CO(2–1) Moment 1 image, and the collapsed CO(2–1) spectrum within a 2″ aperture (also indicated as a red circle). In all ALMA images, the synthesized beam is shown as a gray circle, and contours of 2σ, 4σ, 6σ, and 8σ are shown as increasingly thick lines. The velocity region integrated to measure the CO flux is shown with dashed lines.
Other Images in This Article
Show More
Copyright and Terms & Conditions
© 2025. The Author(s). Published by the American Astronomical Society.