Image Details
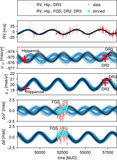
Caption: Figure 8.
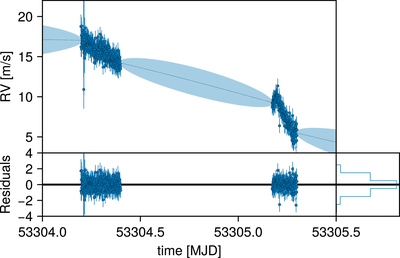
Zoom in of Figure 3 showing the dense sampling of HARPS data over 1.5 days in 2004 October. The blue line and band show the GP model mean and standard deviation, respectively. The planet’s contribution to the RV signal is essentially flat over this short time range. The inclusion of these data in particular causes an apparent eccentricity signal if not modeled with a GP. Dropping these data leads to a low-eccentricity solution, even without a GP.
Other Images in This Article

Copyright and Terms & Conditions
© 2025. The Author(s). Published by the American Astronomical Society.
Copyright ©
2025 Astronomy Image Explorer. All Rights Reserved.