Image Details
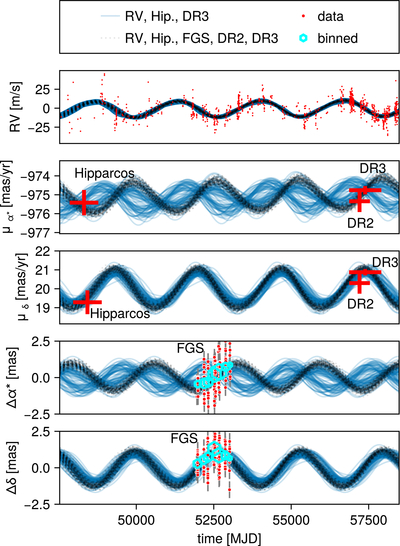
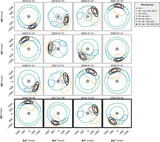
Caption: Figure 4.
Orbits sampled from the RV, Hipparcos, DR3 model (blue) and the complete RV, Hipparcos, FGS, DR2 and DR3 model (black) compared against all data. This shows how the addition of the DR2 and FGS data constrains the motion of the star in the R.A. direction. The horizontal bars in the proper-motion panels show the time range over which each measurement is fit by their respective catalogs. The light blue markers show binned FGS data, with the size of the marker indicating the number of data points in the bin.
Other Images in This Article

Copyright and Terms & Conditions
© 2025. The Author(s). Published by the American Astronomical Society.
Copyright ©
2025 Astronomy Image Explorer. All Rights Reserved.