Image Details
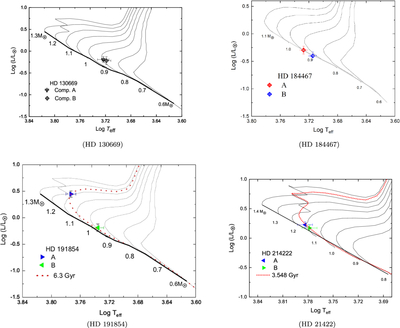
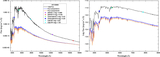
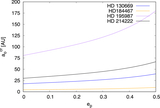
Caption: Figure 5.
H–R diagr,ams for the binary systems HD 130669, HD 184467, HD 191854, and HD 214222. The positions of the individual stellar components (A and B) are plotted with their respective uncertainties. Evolutionary tracks corresponding to different stellar masses are shown by black lines, while the system’s best-fitting isochrone (age) is indicated by a red dotted line. The zero-age main sequence (ZAMS) is depicted as a thick solid black line. These diagrams were constructed using the evolutionary models to determine the masses and ages of the components based on their effective temperatures and luminosities.
Other Images in This Article
Copyright and Terms & Conditions
© 2025. The Author(s). Published by the American Astronomical Society.