Image Details
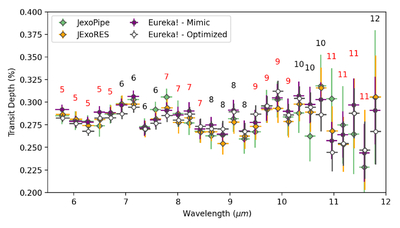
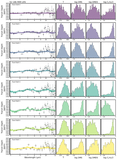
Caption: Figure 1.
A comparison between K2-18b MIRI transmission spectra. The JexoPipe and JExoRES spectra are from M25. Eureka!’s mimic spectrum adopts the same settings described by M25. Eureka!’s optimized spectrum uses settings that minimize the white-light-curve MAD value. When adopting the same wavelength binning scheme, the spectra from both Eureka! reductions are comparable (i.e., within 1σ) to those from M25. The numerical values indicate the number of pixel rows used in a given spectroscopic channel. As discussed in Section 2.1.1, channels with red numbers have the least reliable transit depths.
Other Images in This Article
Copyright and Terms & Conditions
© 2025. The Author(s). Published by the American Astronomical Society.
Copyright ©
2025 Astronomy Image Explorer. All Rights Reserved.