Image Details
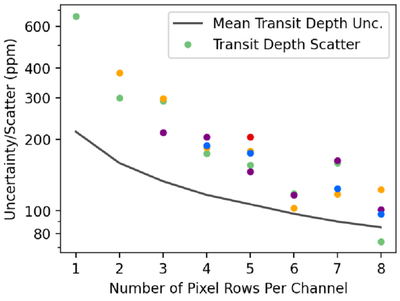
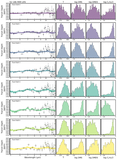
Caption: Figure 3.
Observed transit depth scatter (colored circles) compared to the mean transit depth uncertainty (black curve). We quantify the scatter by computing the median absolute difference (MAD) between adjacent channels. The colors represent different pixel shifts and correspond to those shown in Figure 2. For a low SNR spectrum, like that of K2-18b, the scatter should not significantly exceed the mean transit depth uncertainty. Furthermore, the scatter should be relatively consistent between pixel shifts. For this test, we achieve the most robust transit depths with six or eight pixel rows per channel; however, we caution against simply adopting these binning schemes for other data sets without first conducting similar tests.
Other Images in This Article
Copyright and Terms & Conditions
© 2025. The Author(s). Published by the American Astronomical Society.