Image Details
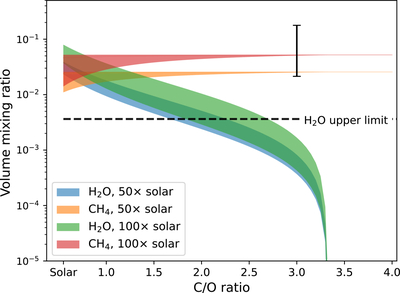
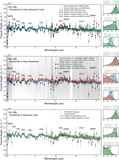
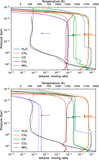
Caption: Figure 10.
The equilibrium abundances of H2O and CH4 as a function of C/O ratio. The shaded regions represent the range across pressures from 100–1 bar and temperatures from 800–1000 K, which cover the expected quench levels. The dashed line is the 2σ upper limit of H2O from our retrieval analysis, and the open circle with an error bar represents our retrieved 1σ CH4 abundance.
Other Images in This Article
Show More
Copyright and Terms & Conditions
© 2025. The Author(s). Published by the American Astronomical Society.
Copyright ©
2025 Astronomy Image Explorer. All Rights Reserved.