Image Details
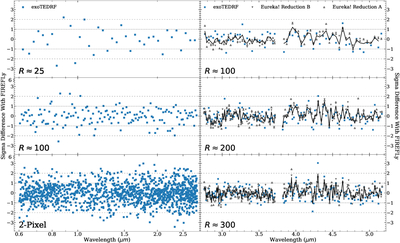
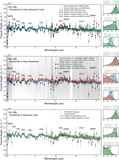
Caption: Figure 21.
Significance of the discrepancy in transit depths between the FIREFLy reduction and the three other independent reductions. On the left three panels, we plot the significance between NIRISS reduction at R ≈ 25 (top), R ≈ 100 (middle), and at the 2 pixel level (bottom). On the right three panels, we plot the significance between NIRSpec reductions at R ≈ 100 (top), R ≈ 200 (middle), and R ≈ 300 (bottom). Using the same color scheme as Figure 2, we plot as blue squares the exoTEDRF reduction and as gray triangles the Eureka! reductions, distinguishing between the two with unfilled downward-pointing (A) and filled upward-pointing (B) triangles. We plot as a black solid line on the right three panels the average deviation between the three, and as gray horizontal lines the 1σ (densely dashed) and 2σ (sparsely dashed) cutoffs. Our reductions are consistent with one another, although the rate of >2σ outliers increases with higher resolution.
Other Images in This Article
Show More
Copyright and Terms & Conditions
© 2025. The Author(s). Published by the American Astronomical Society.