Image Details
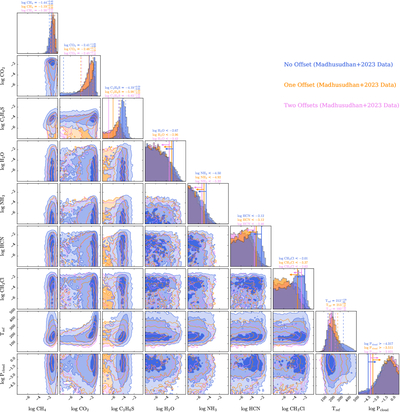
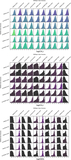
Caption: Figure 16.
Corner plots corresponding to Figure 15, showing correlations between key atmospheric parameters. Parameters with only an upper or lower limit are marked by a vertical line and arrow at the 95% credible interval. We include 1σ credible regions for CO2 and DMS, even though they are not robustly detected, for comparison with N. Madhusudhan et al. (2023).
Other Images in This Article
Show More
Copyright and Terms & Conditions
© 2025. The Author(s). Published by the American Astronomical Society.
Copyright ©
2025 Astronomy Image Explorer. All Rights Reserved.