Image Details
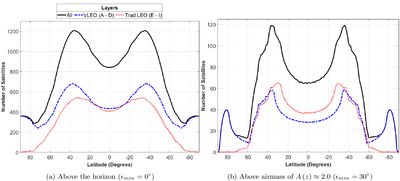
Caption: Figure 1.
24 hr mean Starlink Gen2 satellites visible by latitude in line-of-sight (but not necessarily illuminated) above the horizon (1(a)) and ﹩A\left(z\right)\approx 2.0﹩ (1(b)). The plots show the full constellation, layers A–D <450 km, and layers E–I >450 km. Irregularities in the curves are caused by the motion of the constellation as modeled over the time period.
Other Images in This Article
Copyright and Terms & Conditions
© 2025. The Author(s). Published by the American Astronomical Society.
Copyright ©
2025 Astronomy Image Explorer. All Rights Reserved.