Image Details
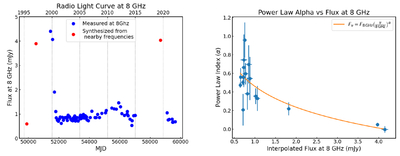
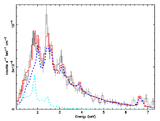
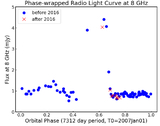
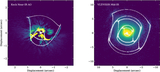
Caption: Figure 5.
Left: the 8 GHz light curve of WR 112, including synthesized flux estimates when only nearby frequencies were available. Right: the spectral index correlation with flux, as WR 112 transitions from the “high state” dominated by nonthermal radio emission to the “low state” where we only see thermal (free–free) emission from the ionized winds.
Other Images in This Article

Show More
Copyright and Terms & Conditions
© 2025. The Author(s). Published by the American Astronomical Society.
Copyright ©
2025 Astronomy Image Explorer. All Rights Reserved.