Image Details
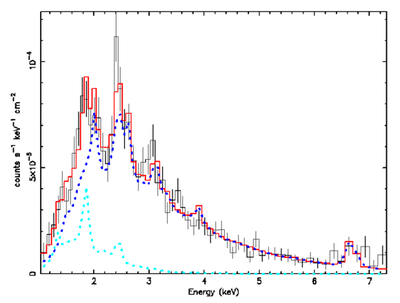
Caption: Figure 4.
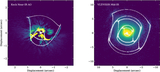
The summed Chandra/ACIS X-ray spectrum of WR 112. The data are binned for visual clarity. The best-fit two-temperature plasma model is shown in red (tbabs×vapec+vapec). The kT = 0.5 keV and kT = 2 keV components are shown in cyan and blue, respectively. The strongest lines in the model are He-like Si XIII, S XVI, Ar XVII, and Fe XXV (1.87, 2.46, 3.14, and 6.70 keV, respectively). The spectrum is obscured at low energy by the high line-of-sight column density. See Table 3 for model parameters and errors.
Other Images in This Article

Show More
Copyright and Terms & Conditions
© 2025. The Author(s). Published by the American Astronomical Society.
Copyright ©
2025 Astronomy Image Explorer. All Rights Reserved.