Image Details
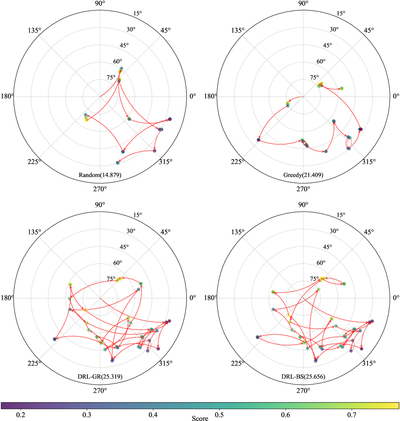
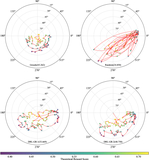
Caption: Figure 7.
Scheduled performance comparison of four algorithms. Target-switching sequences are indicated by red arrows, while scatter point colors represent instantaneous reward scores scaled from zero to one (see color bar). The total reward scores for each algorithm appear parenthetically after the algorithm names. The bottom subplots demonstrate significantly enhanced task completion rates and total scores achieved by our DRL-based methods using GR and BS selectors.
Other Images in This Article
Copyright and Terms & Conditions
© 2025. The Author(s). Published by the American Astronomical Society.
Copyright ©
2026 Astronomy Image Explorer. All Rights Reserved.