Image Details
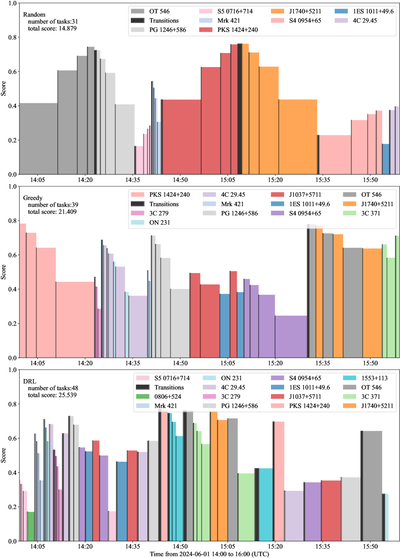
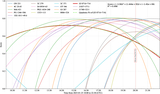
Caption: Figure 6.
Comparative visualizations of the scheduled observation plans. The top panel presents the plan simulating manual observations (“Random”), the middle panel displays the results generated using the greedy algorithm (“Greedy”), and the bottom panel shows the observation plan generated by our proposed DRL-based model (“DRL”). The width of the black bars indicates the switch time, while the width of the colored bars indicates the observing time of the task.
Other Images in This Article
Copyright and Terms & Conditions
© 2025. The Author(s). Published by the American Astronomical Society.
Copyright ©
2026 Astronomy Image Explorer. All Rights Reserved.