Image Details
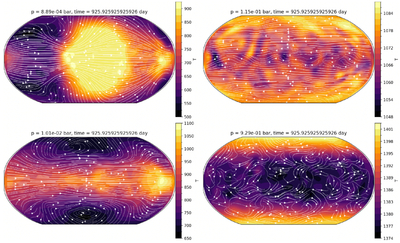
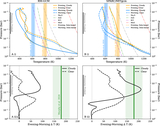
Caption: Figure E1.
Temperature and circulation maps of WASP-107 b at various pressure levels from our cloudy SPARC/MITgcm model. Each panel represents a slice along a different isobar. The color mapping represents the gas temperature, and we use a different scaling in each panel. The lines with arrows represent the wind direction.
Other Images in This Article
Show More
Copyright and Terms & Conditions
© 2025. The Author(s). Published by the American Astronomical Society.
Copyright ©
2026 Astronomy Image Explorer. All Rights Reserved.