Image Details
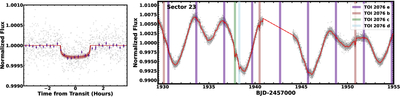
Caption: Figure 2.
(Left) TESS light curve binned to 10 minutes intervals and phase-folded (gray points) with the full (unbinned) TESS light curve phase folded and binned to 15 minutes intervals for clarity (purple points). The best-fit transit model is shown as the bright, opaque red line with 25 model fits pulled from the posterior shown as the dark, translucent red lines. The best-fit GP stellar variability model has been removed from the data and transit model. (Right) Representative section of the TESS light curve (gray points) with the best-fit GP model (red line). Transits of TOI 2076 e are highlighted in purple, and transits of TOI 2076 b, c, and d are highlighted in pink, green, and blue, respectively.
Other Images in This Article
Copyright and Terms & Conditions
© 2025. The Author(s). Published by the American Astronomical Society.