Image Details
Caption: Figure 1.
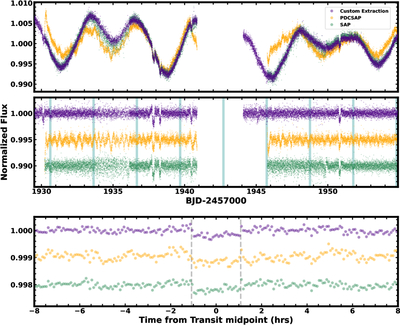
Our custom-extracted light curve (purple) compared to the PDCSAP (orange) and SAP (green) light curves for Sector 23. The top panel shows the raw, normalized light curves, and the middle panel shows the notch-detrended light curves, using a 0.75 day filtering window, with the transits of TOI 2076 e highlighted in teal and a y offset between the extractions for clarity. The raw and detrended custom light curves show significantly less noise than the PDCSAP light curves. The bottom panel shows the phase-folded light curves binned to 5 minute intervals with a y offset for clarity. The gray dashed lines mark the expected ingress and egress. The custom-extraction light curve shows a clear transit-like shape while the PDCSAP light curve is too noisy to detect the transit. The custom extraction light curve is available in machine readable format as the data behind the figure.
(The data used to create this figure are available in the online article.)
(The data used to create this figure are available.)
Other Images in This Article
Copyright and Terms & Conditions
© 2025. The Author(s). Published by the American Astronomical Society.