Image Details
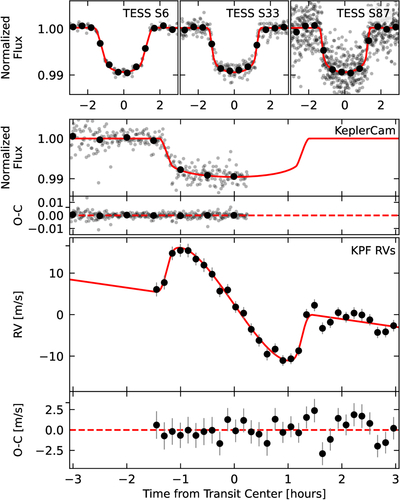
Caption: Figure 3.
Results from joint modeling of photometric and RV observations. In all panels, the red line shows the best-fit model. The light gray dots show unbinned photometric data, while the black points in the top two rows show the same data binned to 1800 s cadence. The TESS data have been phase-folded according to the best-fit transit ephemeris. For the RV data, unbinned data are shown as black points, and an arbitrary offset has been removed. The error bars for the KPF data have been reduced according to the best-fit jitter value. The data behind this figure are available in machine-readable form.
(The data used to create this figure are available in the online article.)
(The data used to create this figure are available.)
Other Images in This Article
Copyright and Terms & Conditions
© 2025. The Author(s). Published by the American Astronomical Society.