Image Details
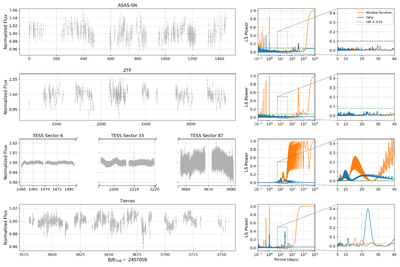
Caption: Figure 1.
Photometric data used for our initial rotation period search. Each row shows a different data set. Note the different x and y scales for the light curves. LS periodograms of each data set are shown in blue to the right of their respective light curves, with the window function of the data shown in orange. The FAP = 0.01 level is indicated with a dashed green line. We also show a zoom-in on the periodograms from 5 to 40 days. A significant, narrow peak is detected in the Tierras data at 23.5 days.
Other Images in This Article
Copyright and Terms & Conditions
© 2025. The Author(s). Published by the American Astronomical Society.
Copyright ©
2025 Astronomy Image Explorer. All Rights Reserved.