Image Details
Caption: Figure 2.
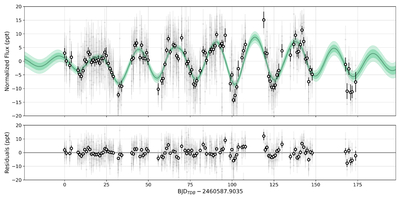
Top: Tierras light curve of TOI-2364. Data at the native 30 s cadence are shown in gray, with their error bars scaled by a factor of 1.66 compared to our calculated photometric uncertainties. White points points with error bars show the median flux measured on each night. The best-fit QP-GP model is shown as a green line, along with its 1 and 2σ uncertainty intervals as shaded regions. Bottom: the residuals from the best-fit QP-GP model.
Other Images in This Article
Copyright and Terms & Conditions
© 2025. The Author(s). Published by the American Astronomical Society.
Copyright ©
2025 Astronomy Image Explorer. All Rights Reserved.